

The Combined Maps from China and the West of Xu Chaojun
Xu Chaojun’s celestial maps are a colorful view of the heavens and an overlooked source in the history of numeracy.
I am fascinated by different tools related to time, and I love maps. So it’s probably not a shock that I am interested in finding and collecting a variety of different celestial maps that were printed in late imperial China.
There are some brilliant terrestrial maps that were printed in China, which have inspired a variety of different studies on the technologies of printing and the techniques that informed the mapmaking. We have rare examples here at the University of Michigan. And a couple of years ago, our museum was collaborating with several other institutions to conduct additional research on the well-known blue maps. (Richard Pegg has recently made an exhibition of these maps.)
But scholars have not usually devoted specific effort to studying celestial maps. There are a couple of a new studies in China that I have linked to below. But most scholarship in English on the topic has focused on the general practice of celestial mapping and the influence of Western mapping techniques. With the exception of the History of Cartography Volume, I don’t think we have a strong sense of the different kinds of celestial maps that were produced in China, the techniques involved in making them, and how people were using them.
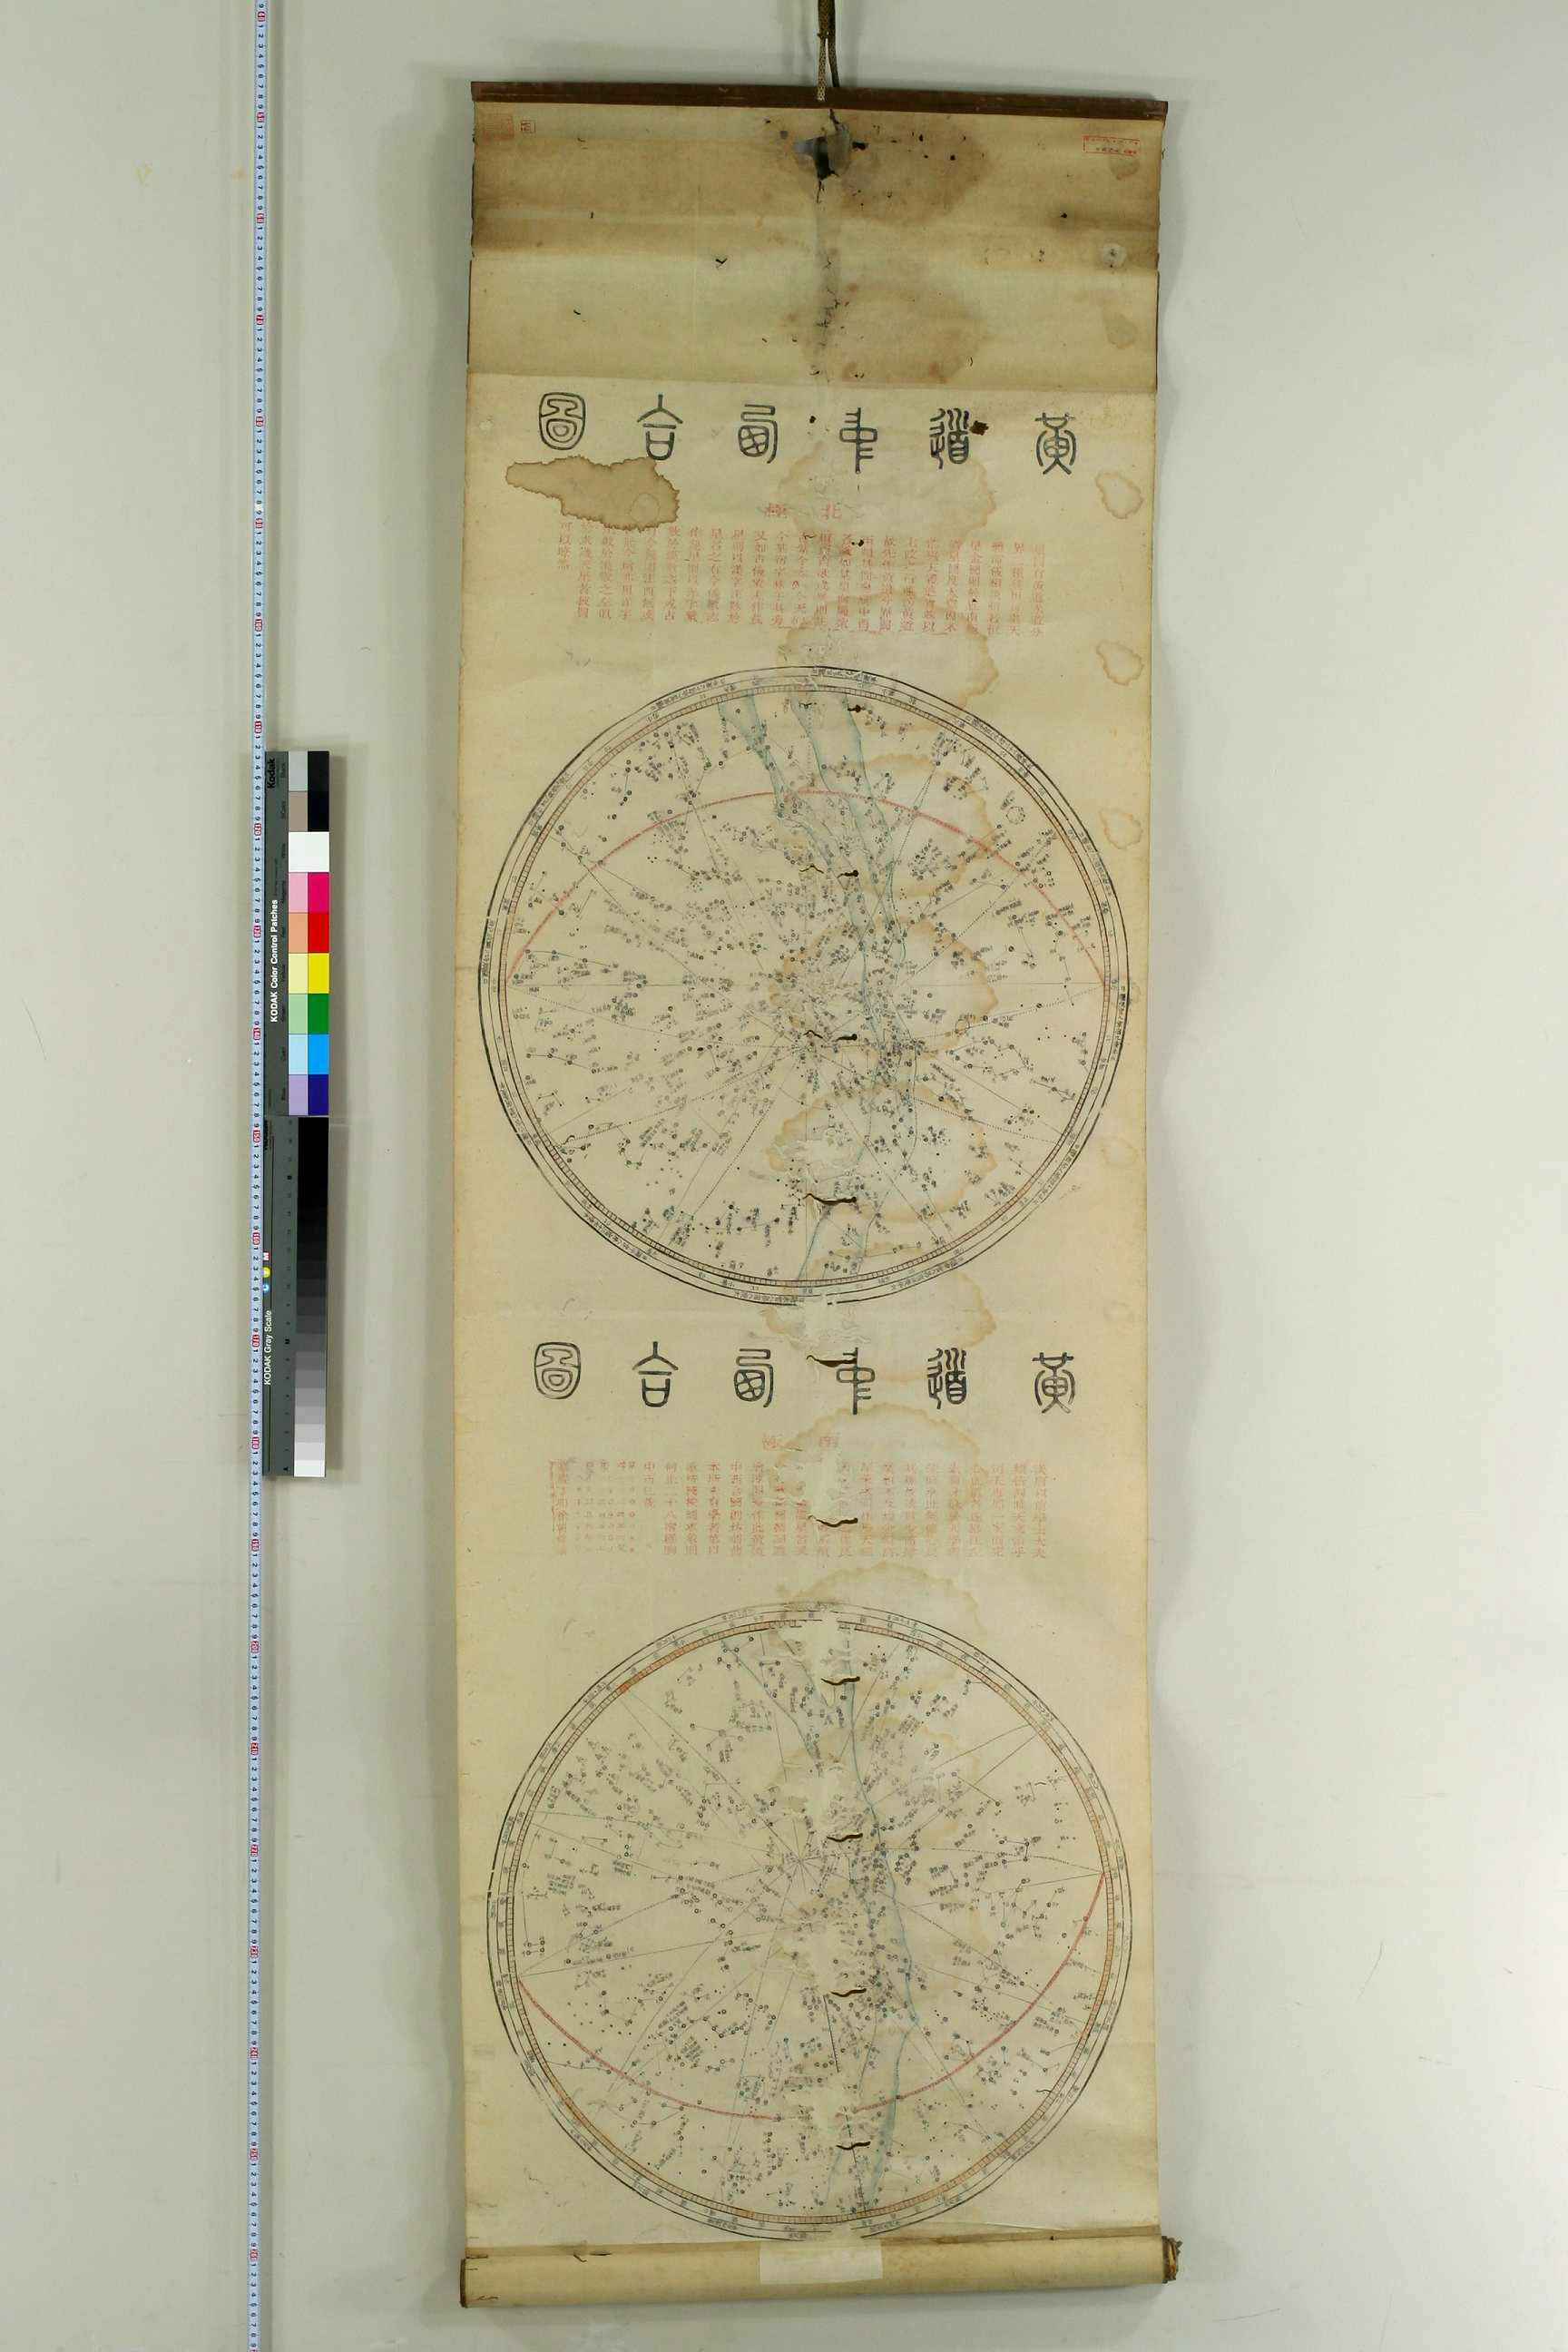
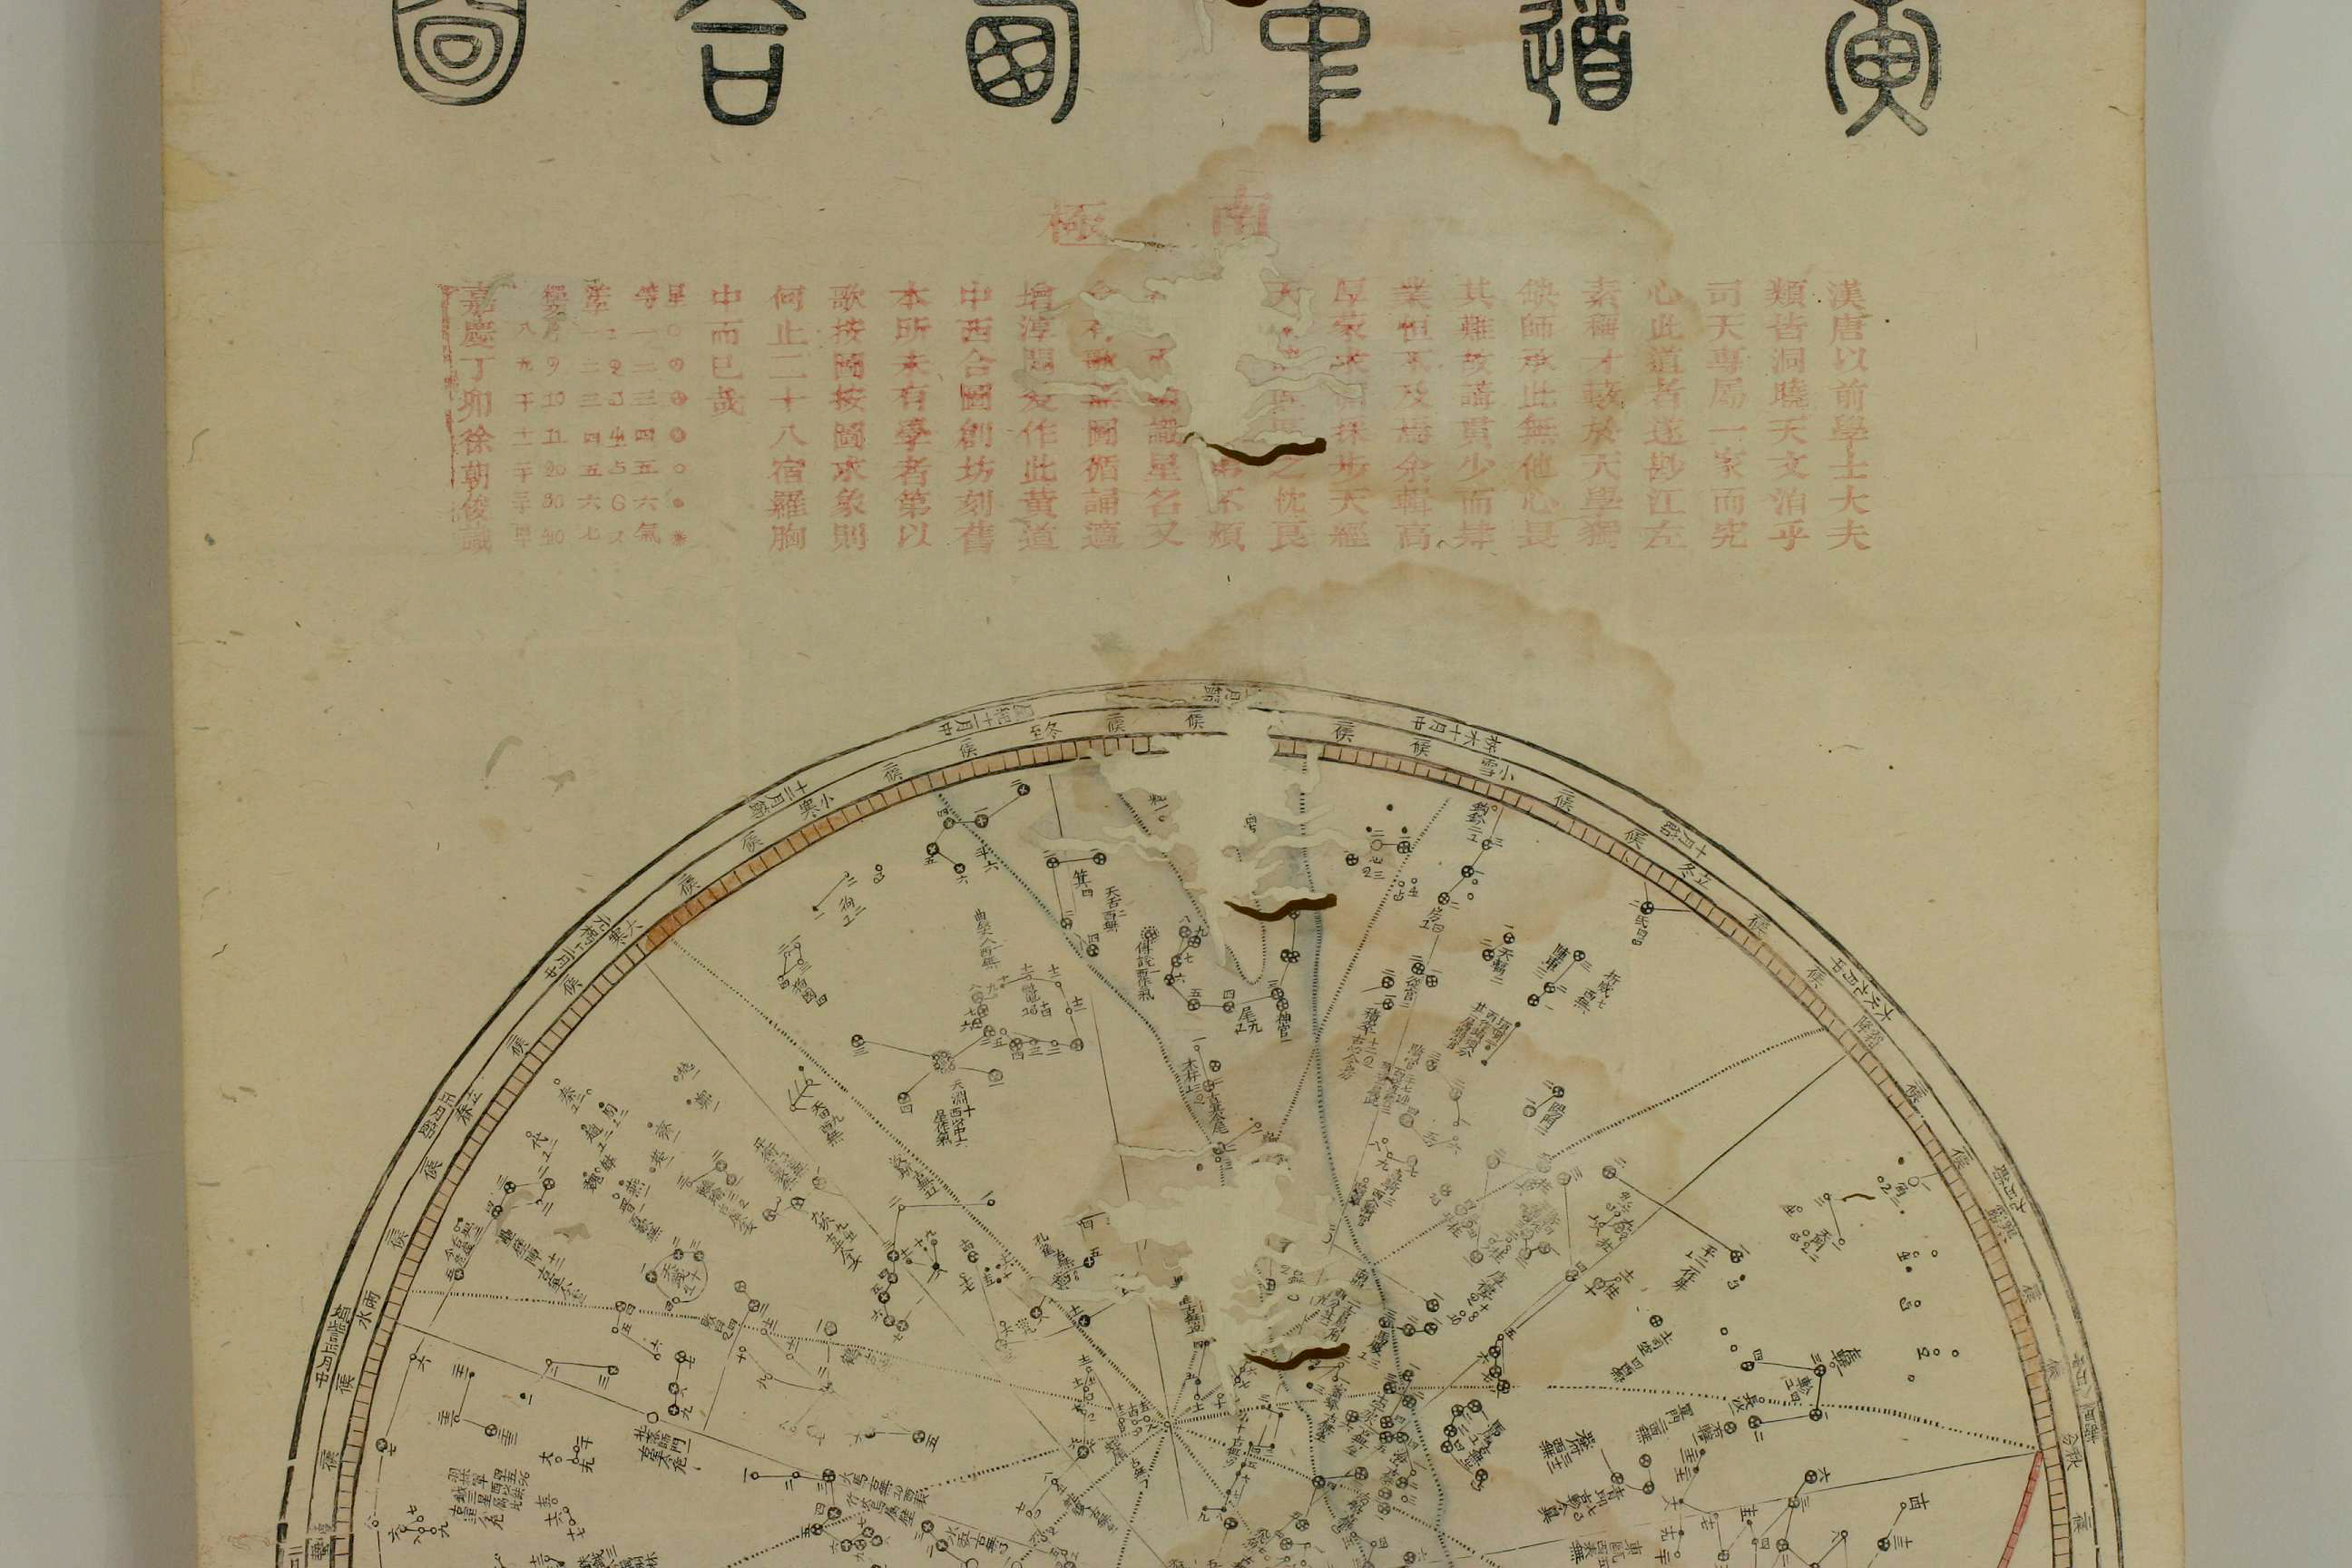
Here is a full view of the map. The map treats the heavens as a sphere and uses the north celestial pole as the center of one image, and the south celestial pole as the center for the second image. The blue strip through the images is the Milky Way galaxy. The yellow line is the path of the ecliptic (the path of the sun), and the red line is a projection of the earth’s equator. Source: Waseda University
Xu Chaojun’s Celestial Map
One of the most interesting maps I have found in recent months is the combined Chinese-Western planispheric celestial map by Xu Chaojun (1752-1823). Xu was an instrument maker, seal expert, and academy teacher who lived half-way between Suzhou and Shanghai. We know a little about him based on his other publications and references to him in local literature. There is one brilliant recent article on him in Chinese, and I’m working with several additional sources I have found about him for an English-language article about his life and contributions.
An earlier generation of scholars thought that he was a descendant of Xu Guangqi, who was one of the high officials in the late Ming period who supported Matteo Ricci and the Jesuits and became a major figure in the Chinese Catholic church in Shanghai. But more recent research has clarified that Xu Chaojun and Xu Guangqi are not directly related. Xu Chaojun came from the same Xu clan as the famous Christian convert, and a similar region, but he was a descendant from cousins removed by a couple of generations already in Xu Guangi’s time.
Xu’s map dates to 1807 and was a supplement to his book project, called the Gaohou mengqiu, a multivolume work which introduced many figures to the literature on instrument-making, astronomy, and geography.
There are at least three extant copies for Xu’s map that are in various collections and libraries. One copy belongs to the Oxford University’s 5-volume 1834 edition of Xu’s book. But this edition is not available online for viewing, and will have to wait until I have the chance to visit the Bodleian again before I can comment more about it.
But the second version is one that is held in the Waseda University collection in Japan. According to the catalogue, the map was a part of the library collection of Shunjō Ichishima 市島謙吉 (1860-1944). He was a Japanese journalist who had a long history with Waseda University and libraries in Japan from the late 19th and early 20th century. Yet it seems likely that his map came to Japan not long after it was published in China. The library’s copy of the Gaohou mengqiu includes seals that date the actual book, which would have accompanied the map, to the early nineteenth century and the library of the bibliophile Yashiro Hirokata (1758—1841). This is fascinating and deserves far more study. But for me it is one of the illustrations for the more complicated circulation of ideas about clocks and cartography which was not entirely based on the direct transmission via Dutch or Western traders, but a far more comparative and entangled history.
Anyway, moving on, another copy was sold at auction by Daniel Crouch Rare Books, a London-based rare books seller. The house did not include any additional information about the provenance of this object, but it seems to have been sold by the Hong Kong office. The second copy is in particularly good condition. The Waseda University edition appears to be in its original mounting, but the map is smudged, and so parts of the copy in Japan are difficult to read and make out. This second edition however is pristine without any particular smudge marks. Although I have not viewed it in person, according to the catalogue description, this version of the map does differ in some regards to the other edition however. It appears that each of the two views (the view of the north celestial pole and the view of the south celestial pole) have each been mounted on a different scroll. Was this the original mounting? When the maps were made, they would have been printed on two separate sheets of paper. This is also true of the Japanese edition. Near the top of the southern projection of the Japanese edition, there is a line that would have formed the glue where the two pieces of paper were attached to create the entire scroll.

Here are two different views of the scroll edition. Look near the center, and you will find a line where the edges of the two sheets of paper were combined and attached.
Unfortunately, the Rare Books sellers did not take pictures of the scroll mounts. So it’s hard to identify if this second model represented a second type of frame. We are left to wonder how these maps would have been initially sold. Were they sold, already mounted for the user? Or would someone have paid for the mounting after purchase (or done it themselves)? Without additional images of the scroll mounts, I think we have to say that this a rather difficult question to answer at the moment.
Map Display
The map is noteworthy for several reasons. The first is that it helps us know much more about the display of maps. Although these two editions make it somewhat confusing as to whether the original maps were framed as a single, long-hanging scroll or if they were framed as two medium-sized scrolls, both examples highlight the fact that the celestial maps were meant to be displayed as scrolls.
Let me say a little bit more about that. We know very little about the actual practice for how maps were used. I think nearly all of the literature has focused on the production of maps (especially to compare Chinese mapping with quantitative cartography) without much comment or reflection on the actual practices for how people would have looked at and used such maps. And to add to the confusion, some maps were particularly restricted to only certain audiences, which makes finding such information even more difficult and limited.
Star maps, though, can be found in a variety of different media in China. For instance, the inscribed Suzhou star map is one of the best illustrations of premodern Chinese mapping, and this map was made in stone. There are many others though. Some charts were printed and circulated on single sheets and as special sheets included in books. Some maps were included on domestic furniture such as folding screens. Although globes (both celestial and terrestrial) are less common, there are examples of this type too. And there are other examples of hanging scrolls.
Hanging scrolls are particularly interesting, because they both reflect a particular kind of literati aesthetic and a popularization. Consider for a second. Hanging scrolls are usually thought of as a form of literati painting. Late Ming scholars used to open scrolls with friends and share the scrolls with poetry and seal inscriptions to mark their shared viewing. But when we think of this practice, we are referring to painted scrolls.
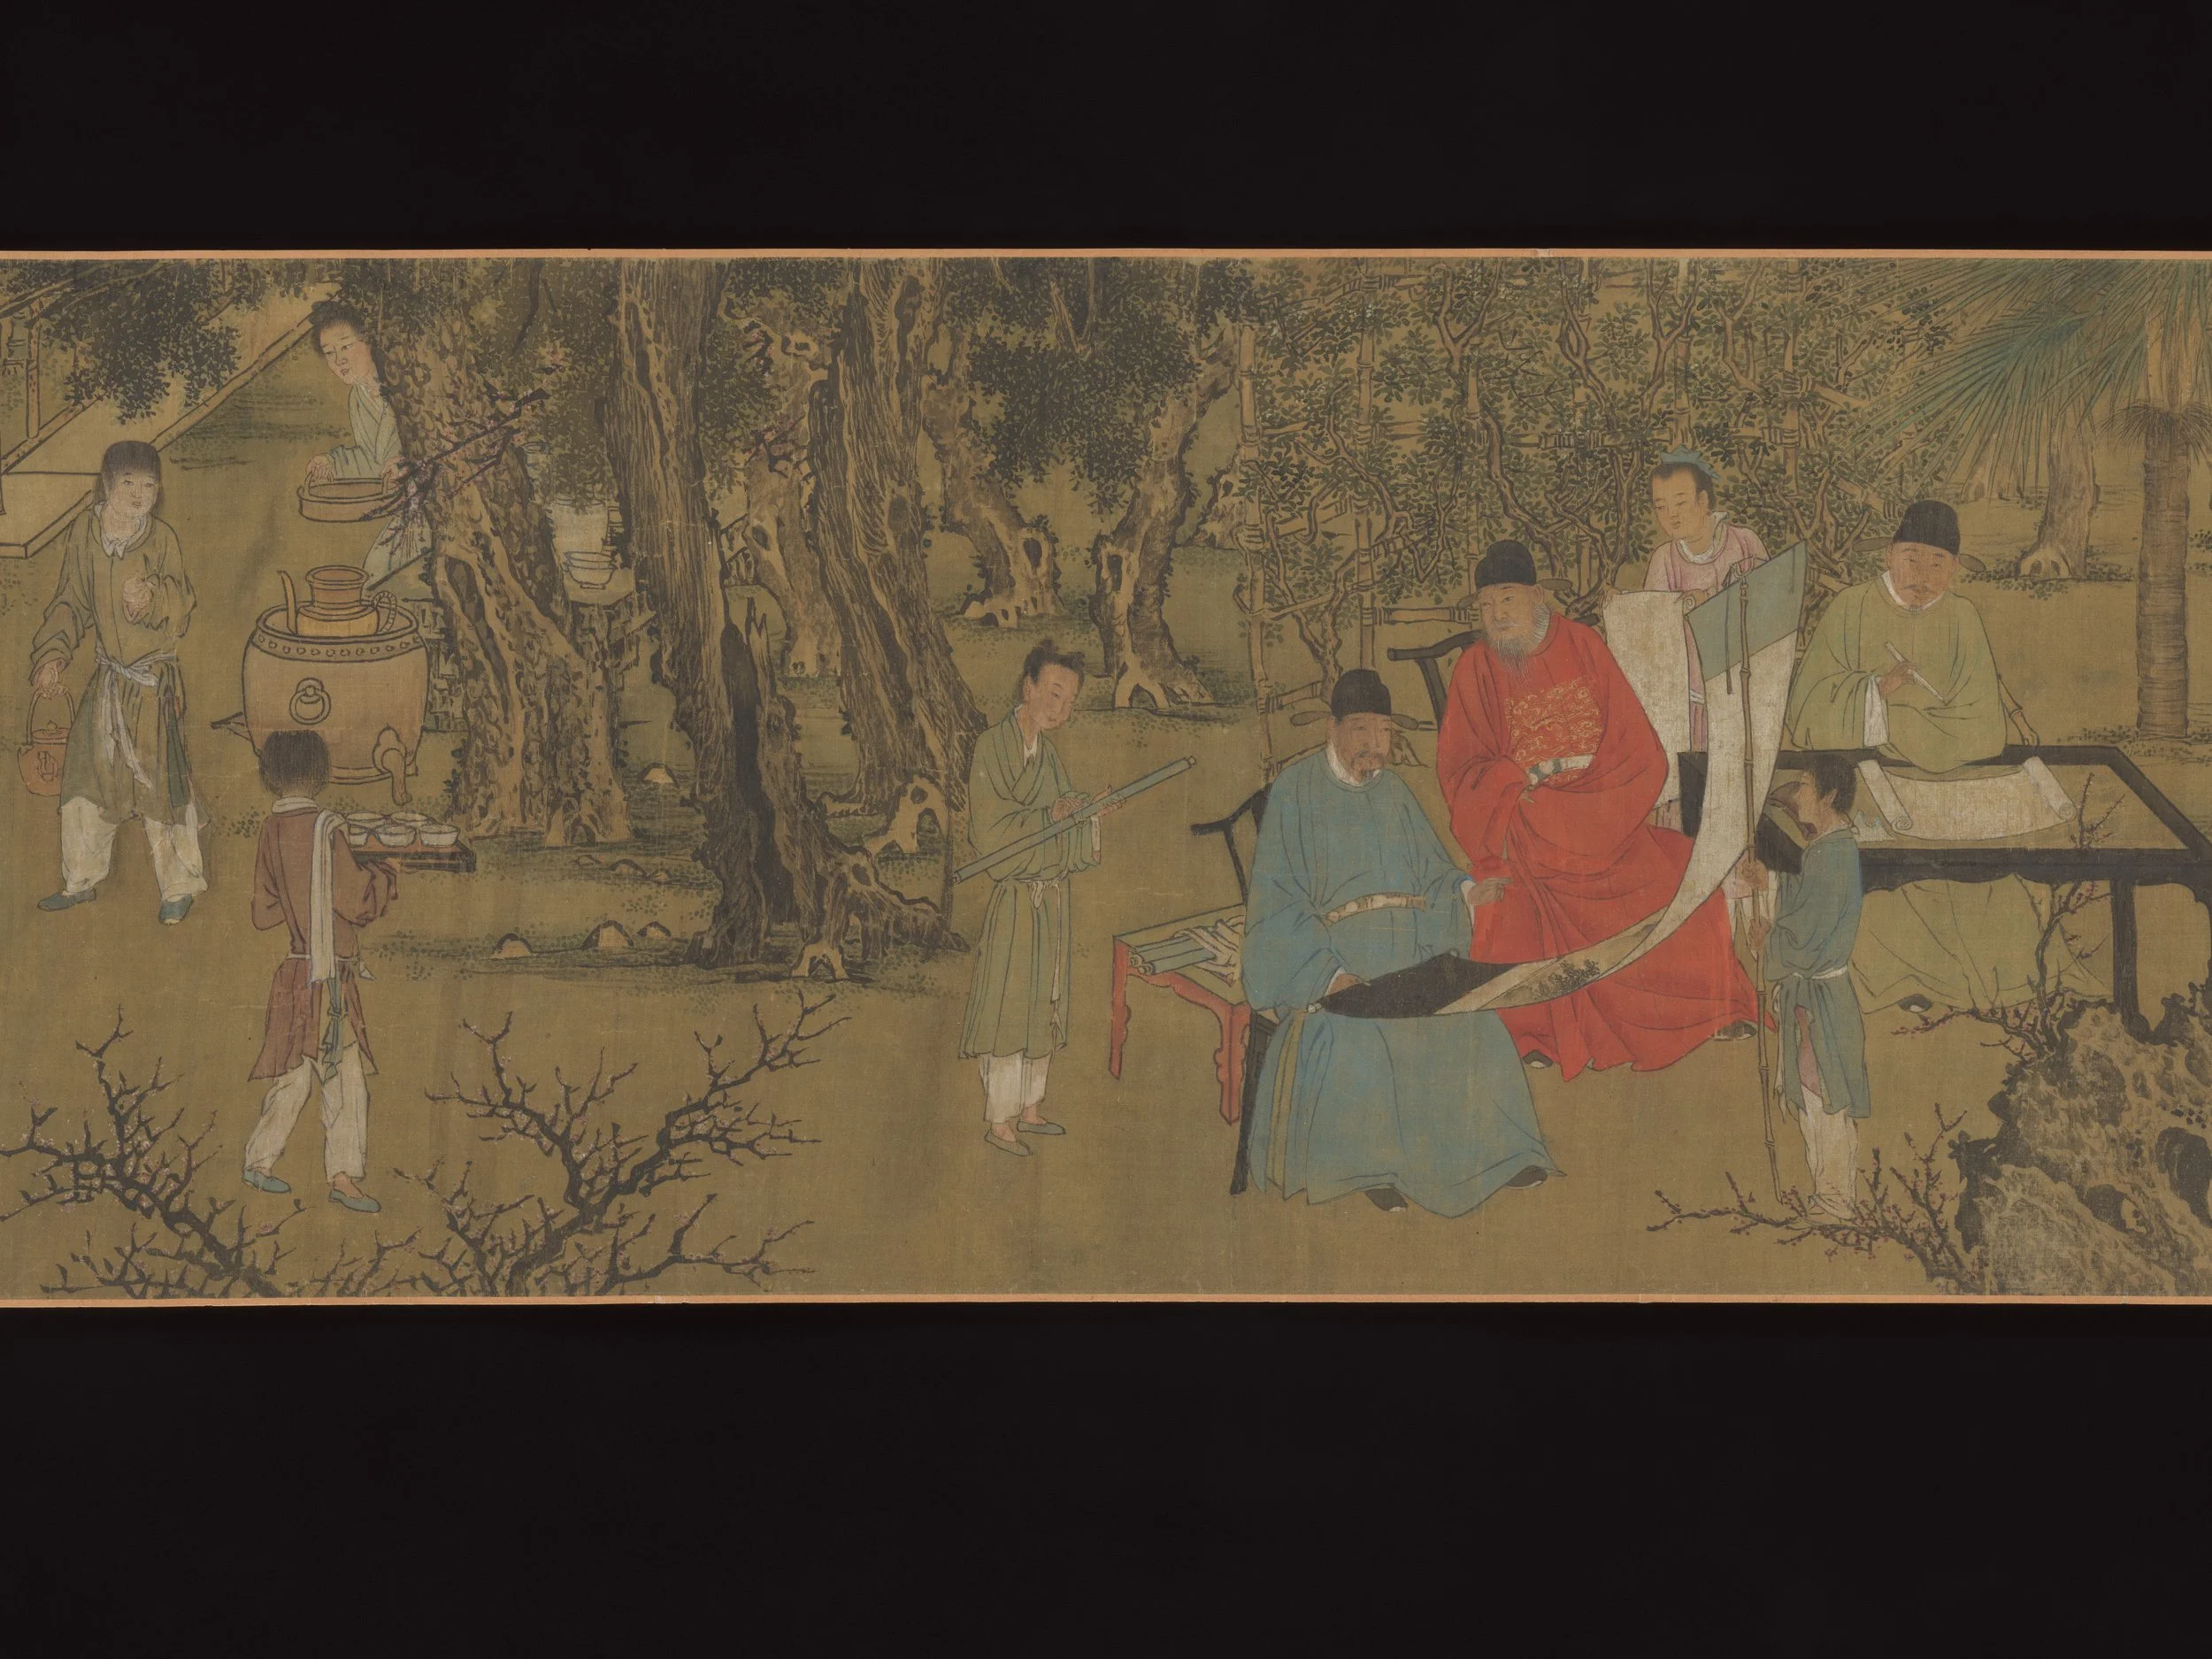
This image is a section from the Ming painting “Elegant Gathering in the Apricot Garden”. The painting includes scenes of gatherings and includes this example of viewing a painting. There are many others in this genre which illustrate the practice as well. Source: Metropolitan Museum
But as should be clear by now, even though these maps are in color, they are not paintings or painted manuscripts. They are prints. They were produced in woodblock and then pressed on paper.
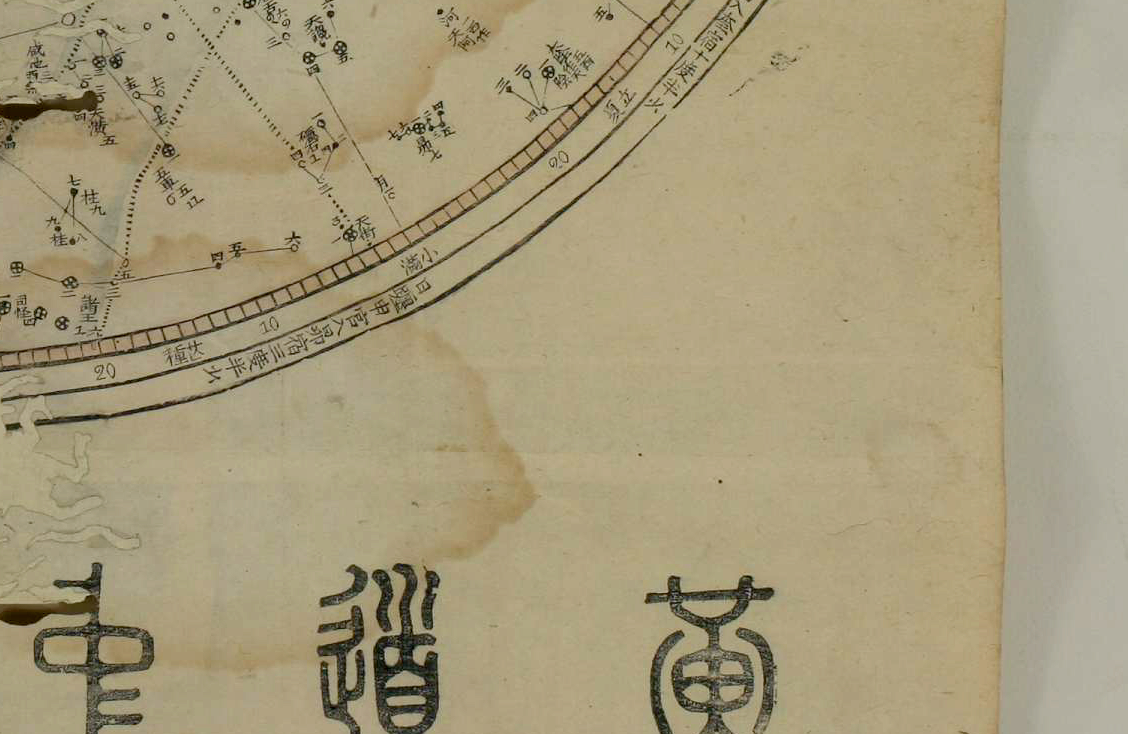
If Xu Chaojun had not mentioned that he printed them in the section on the Southern Hemisphere — which is solid evidence that they were printed — there would still be several clues that these were printed artifacts rather than manuscript maps. While some of the color was likely hand-painted and not printed (I would love to get a closer view of these maps and be proven otherwise), this map was still at least a two-color printed map, what we call the zhumo taoyin 朱墨套印 “block-printing with vermillion and black ink”. This refers to the fact that two different sets of woodblocks with black ink and red ink were used in combination to print the map. The text and label for the map is printed with one type of block in red ink.
But the map itself is printed in black ink. In the bottom right quadrant of sheet that includes the Northern Hemisphere, there are several broken lines on the outskirts of the ring that make me think we are seeing some of the edited lines from the woodblock or a slightly later repair to the woodblock that was used for the printing.

Notice how the outer circle has several broken lines that are not simply explained by the folded paper. (The Crouch edition does contain paper folds, which seems to indicate that it was stored folded, but the broken lines here are not the same as the rest of the paper creases.) Source: Daniel Crouch

In the Waseda University map there are also some broken lines that have nothing to do with folding, which seem to be additional indicators for the kind of printed woodblock here. Source: Waseda University
There are other colors on these maps. For instance, the sun’s path is highlighted in yellow on this map, and the projection of the earth’s equator, which is called the “crimson path” in Chinese, is highlighted in red. These appear to be hand-colored, but hand-painting over a multi-colored print is not unusual .
This type of mixed color printing was a common practice in the world of popular print. That is to say, the multi-color print was one of the main features of Suzhou not far from where Xu lived. The practice was especially important for New Year’s prints, but it was also used in many other local contexts, including advertising, news, and entertainment.
Consequently, the display of this artifact is particularly fascinating because it both attempts to borrow from the elite culture of mounted scrolls, yet at the same time, it borrows the technologies and practices associated with vernacular and popular culture.
Home Display
But this isn’t the only aspect of these maps that is so interesting.
I just explained that one of the points about the scroll maps is that they are fascinating artifacts that operate half-way between popular and elite culture. But one might wonder: did people actually display such things in their home? Or were these just items that someone bought out of a kind of aspirational goal to appear to be engaged in some of the latest discoveries of popular astronomy? I think so. There are two pieces of evidence that give us some broader perspective about how to think about this.
The first comes from some of the work I have been doing in my dissertation, and I do not have the space to explain the entire context here, but the key point is that scroll-mounted celestial maps were not made by Xu Chaojun alone. Other instrument makers also produced these objects, and they included some instructions on how to use them. In one such example, the author wrote that one should hang these kinds of maps in the courtyard of one’s home. When set up correctly, one could use them as a type of night clock and calendar. If aligned to the proper orientation, one could track the days and stars of the year. Although these maps are largely static, those authors claimed that they designed the plates to be rotating plates, so that one could adjust it then as well.
While a slightly different context, these instructions indicate that these kinds of maps were meant to be used as a tool for a family to identify time and create a special ritual calendar that could be used for knowing when to conduct seasonal rituals as well as tracking one’s astrology.
Clearly, one user of these maps used it in some of this way. The northern hemisphere projection from the Rare Books edition demonstrates that the previous owner of the map tried to do something like this. Several constellations on the northern hemisphere are specifically marked on the map in pinkish red. While the labels included a legend — which I will come to in a minute — the legend was not based around color. The map from Japan, for instance, does not seem to have any additional color added for the stars. Instead, the previous owner of the Rare Book map appeared to have modified the map for tracking some particular stars. My speculation is that this was a part of the practice for identifying stars that were relevant to family members, a practice that was encouraged by several other elite individuals interested in star charts.
Teaching Numerals
In addition to these features of culture and display, these maps are also fascinating because they were meant to communicate Arabic numerals to the audience. While some of the comments about this map state that the map is the first celestial map to use Arabic numerals in Chinese, that is not exactly correct. Ignaz Kogler had already made an earlier map that used Arabic numerals combined with Chinese numerals. But Xu Chaojun certainly was still innovative, because he actively sought to make this idea explicit and explain it in his map.
Kogler’s map was an important background to Xu’s map. Kogler was one of the Jesuit astronomers in the early 18th century. He collaborated with several others and updated the imperial star catalogue. He produced several maps that were meant to represent these changes. These star maps were relatively elite affairs. We have only a few copies of these maps which have survived, one in China and another in Korea. Although Kogler’s star charts would have circulated generally within the imperial textbooks, those maps were not the same as the sheet maps. So, how exactly Xu had access to these maps is something of a mystery. But Xu definitely was relying on this map, not only because he was using a similar title, but because of the particular orientation and stars used.
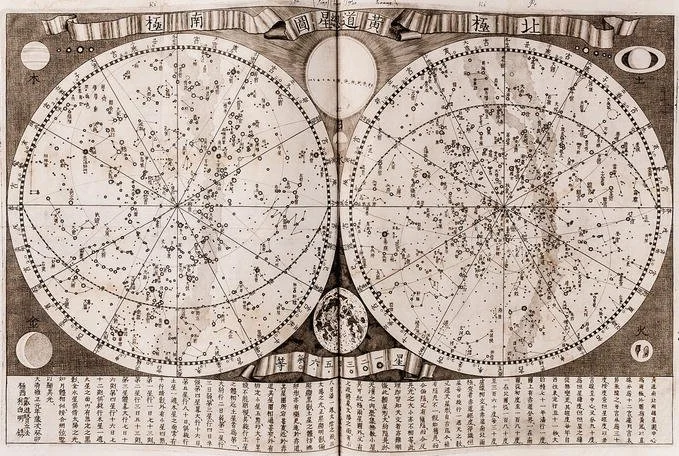
Here is one of the printed versions of the Kogler map. Source: Pegg, The Star Charts of Ignatius Kögler (1680–1746) in the Korean Court
Xu transformed two features of the source map: the legend and Arabic numerals. One of the key features of maps designed by Western missionaries and others in China is the use of a legend to categorize stars. Star categories started to become more common in the late Renaissance celestial maps, whereby the mapmaker used size and shape to indicate the relative size of the star or the star formation. This technique of labeling and sorting stars into six categories was introduced to Chinese celestial mapmaking in the texts included in the Chongzhen lishu, the textbook of Jesuit astronomical reform from the mid-seventeenth century. While it impacted celestial maps, many Chinese authors simply repeated the design pattern rather than provided a legend explaining the meaning of the six levels.
The Kogler map then included a special legend. Smashed between the two planispheric projections, he included a list of the shapes for the six categories of stars in the map. It is set against a background of a flowing ribbon, and one of the large features of the map.
At the same time, Kogler’s map also included Arabic numerals along with Chinese numerals to mark the celestial degrees. None of the earlier maps I have seen, including Schall’s celestial maps and Verbiest’s maps used Arabic numerals. And it is not surprising. These maps were about communicating with the local audience. They worked to translate Western material into a local Chinese idiom, and they shied away from even using transliteration, which was a technique used only sparingly in translation. Also, there was very little need to use Arabic numerals as a presentation, because the Chinese numerals could easily represent them.
Thus, we find that every instrument typically used Chinese numerals to describe degrees. This is why Kogler’s choice is particularly confusing. I think we need to investigate this question more. We do know that in some types of computational practice Western mathematicians and astronomers did train local users in using Arabic numerals as a form of representation for pen-based math; but even in this case, most users preferred to use Chinese. But I suspect that he chose to use the Arabic numerals instead of Chinese in this map, because he created the sheet map especially for display. The map is meant to depict some of the latest achievements in Western science, and it is heavily influenced by Western decorative features more than Chinese.

An example of Suzhou numerals. Source: Wikimedia
Although why Kogler originally chose to mix the numbers , Xu Chaojun clearly took on the role to translate these different symbolic cultures and make this comprehensible to Chinese viewers. In the text attached to the sheet, Xu explains that older maps only used Chinese, but that these new maps had both Western numbers and Chinese numbers to explain degrees. For Xu, this had several functions. One was that it illustrated the change over time. Current practices were different from the past, and they could be an improvement. I think that he implies this idea of improvement, because he offers that the two numbers represent two different types of “number symbols.” While Chinese numerals had previously been used for both the scale of stars (ranking the stars from one scale to another) and for the scale of the degrees, he believed that the two sets of numbers could be applied for two different purposes.
Such a distinction is not surprising because the world of Suzhou and Shanghai was already embedded in this way of thinking about numbers. Chinese numerals were used in classical language and in describing number as a written form. Suzhou numerals or commercial numbers were used as a quick method (and more accessible way to write numbers) in everyday life. Hence, context already mattered for how to think about numbers. And this is something like the difference between writing 1034 and “one thousand thirty-four”. Both represent number, but one is more useful for representing number as a symbol whereas the other is using number as a word. Because Chinese was already ideographic though, this kind of distinction between word and symbol was more relevant in the case of situational context for how to think about the graphical function of the number compared to the classical or aesthetic context for talking about numbers.

This is from the introduction to the southern hemisphere. On the left-hand side, Xu includes a list of the legend for the stars, and he prints Arabic and Chinese numerals matched together. Source: Waseda University
Xu then added the legend to explain these contexts and different ways to read these numbers. In terms of context, he used shapes and Chinese characters to illustrate one way to think about number and rank. Then, he included a list of Arabic numerals from 0-9 to illustrate the relationship between the Arabic numeral and the corresponding Chinese numeral. He added additional ranks upwards to further illustrate the connection with position and Arabic numerals (20 as twenty in Chinese).
Final Thoughts
Although this is a small part of the map, it is one of the most original presentations I have seen for this kind of work in Chinese. Of course, by the standards of astronomy, this work might be viewed as behind the times. The same period was witnessing a major transition as astrophysics was starting to come into its own. But to me that is missing the point about the innovations in Xu’s map. The map is perhaps less important for the particular depiction of the stars and content, but what is much more fascinating is to understand how scroll maps like this were a part of a shifting attitude about how to engage with astronomical material in everyday life.
But even more interesting to me is the fact that this map is one of the earliest cases for explaining how to read Arabic numerals symbolically by a Chinese author. Of course it is not the earliest case for this. Nor is this Xu’s only example. Xu actually cared about this issue much more than I have discussed here. Xu actually was something of an expert in Arabic and Roman numerals, because he designed clockfaces that used these numbers, and created pamphlets that explained how to read them. So the takeaway for me is twofold. Not only were Arabic numerals entering into vernacular life. But they were entering into everyday life through a similar association as other types of tools for computation. This is a fascinating moment of transition, and to me, makes these maps incredibly special markers of a different kind of global history.
Further Reading
Chinese
陈拓 [Chen Tuo], Cong Xu Chaojun dao Xu Jiyu: Jia-Dao shiqi xinjiu xixue de zhishi mailuo 从徐朝俊到徐继畬:嘉道时期新旧西学的知识脉络 [From Xu Chaojun to Xu Jiyu: Intellectual Networks of Old and New Western Studies during the Jiaqing and Daoguang Periods], 青年论坛, 2023, 3: 122-137
潘鼐 [Pan Nai], Zhongguo hengxing guance shi 中国恒星观测史 [The History of Observing and Measuring the Fixed Stars in China].上海:学林出版社, 1989
李亮 [Li Liang], Canlan xinghe: Zhoongguo gudai xingtu 灿烂星河: 中国古代星图 [The Brilliant River of the Stars: The Star Maps of Ancient China],北京: 科学出版社, 2021
English
A. Pegg, Richard. "The Star Charts of Ignatius Kögler (1680–1746) in the Korean Court", Journal of Jesuit Studies 6, 1 (2019): 44-56, doi: https://doi.org/10.1163/22141332-00601004
Jami, Catherine. "Western Devices for Measuring Time and Space: Clocks and Euclidian Geometry in Late Ming and Ch’ing China". 169–200. In Time and Space in Chinese Culture, (Leiden, The Netherlands: Brill, 1995) doi: https://doi.org/10.1163/9789004488281_009
Stephenson, F. Richard. “Chinese and Korean Star Maps and Catalogs,” 511-578. In The History of Cartography, Volume 2: Book 2, Edited by J. B. Harley and David Woodward (Chicago: University of Chicago Press, 1987-2020)
Hashimoto, Keizo, “Jesuit Observations and Star-Mappings in Beijing as the Transmission of Scientific Knowledge,” 129-145. In History Of Mathematical Sciences: Portugal And East Asia II - Scientific Practices And The Portuguese Expansion In Asia (1498-1759), edited by Luis M R Saraiva. (Singapore: World Scientific Publishing Company, 2004)

Research Practice: Organizing with Paper Notes
I've returned to one of my oldest yet tried and true research practices: sorting and organizing pieces of paper.
I've reached that point in the writing process where I need to start reorganizing, but also thinking about the logical structure of all the chapters. How do the chapters contribute to my larger overall argument? It's an important moment. On the one hand, I feel some relief to have largely completed the main part of the writing. But on the other hand, I'm concerned with how to connect the scaffolding. If each chapter is a wall and each section a brick, have I added up the pieces to support the entire home? Do all the parts really work together?
I'm surprising myself to find that it's easier at this point to print everything and work with the single sheets instead of writing on the computer. When I have the sheets in my hand, I can easily flip back and forth to review other pages, remove pages with bookmarks, and adjust it at other angles. As I work with the pages, I'm able to see my writing from new angles, write new comments on the side, and review the structure because I can review the chapters as if they are in a space around me.
Learning How to Take Notes
I used to work like this. And in some ways it's how I was taught to process and edit writing. I remember back in middle school, when I wrote my first research papers, we were taught to create physical notes and develop storyboards. Using a 3 x 5 index card, we wrote notes for the reading. Each note was supposed to be a "single topic" although we had to figure out how we defined "single topic". For instance, we decided if the note was going to be a direct quote from a source, a summary of a source passage, or an individual reflection in response to a reading or data point. To avoid plagiarism, my English and Science teachers (who both required us to use this method) encouraged us to use several visual clues (or reminders) on the note to distinguish which of the three classes our notes fell under. They were concerned that if we took direct quotes on the cards, but did not include direct quotes around it, and so thought that the quote was our own original work, we might later copy this passage and inadvertently commit plagiarism by directly copying somebody else's work.
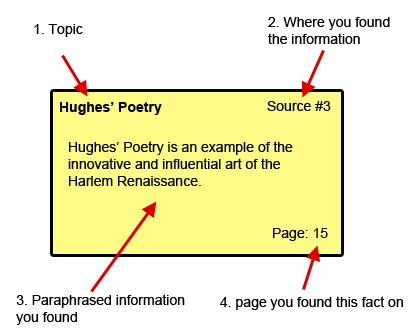
Notecard Example
This image from Gallaudet’s resources on researching is a similar example to the type of indexing system I was
Another check against direct copying though was the page number. After the initial note, you needed to add the page numbers or some kind of reference to the location where this passage came from. This was always helpful. The only case that it mattered less was if the notecard was a "thought-processing" card. Those were cards from the third category and maybe even extended into a fourth category. These cards represented creative thoughts and reflections about the general topic, but they were not necessarily derived from a specific source. They were self-reflective and argument building cards.
How To Use Headings
The most important part of the process though was the heading. Each note had to have some kind of label. The labels at the top were used to define how this note related to the questions we were asking in our research. So if the question were something like, "how did Babe Ruth shape mid-century baseball?", we would need to include some individual statement that clarified how that note about his batting average related to the topic. So in that example, I might have added "statistics" at the top of the card. It's not very descriptive, but it was an easy title which could be used to know that this card related to stats and the impact of say a batting average on the field. (These are purely manufactured examples, so I know die-hard baseball fans likely will have a clear answer that batting averages were not used as a measure until such and such a year. But I digress.)
Anyway, the second most important element in the heading was the citation and direction of the notecard. Each notecard was supposed to include a keyword that related it to the bibliography or source cards. Bibliography cards were an entirely separate deck of notecards. For every source that we encountered, we were supposed to create a bibliography card. The bibliography card contained all the relevant citation information: author, title, publisher, dates, edition. At the top of the bibliography card, we added another keyword for the short title. That keyword then was the word used in the reference card deck.
On the far left side of the notecard, we were supposed to add "directional" information on the card. That's my term. But I think its apt. When I was taught this method, they called it the outline component of the card. That is, we were supposed to add a short reference to our pre-writing outline. "IV.A.1". That kind of thing. Looking back, this was a mistake in the method. I was always confused why I had to add this, when I was aware that the outline would likely change. And it felt like I was committing to something too far in advance. That feeling was justified. I think we would have been better served to have added those annotations after we started the resorting process and started to write the first draft. Those kinds of notes would have been helpful as we re-processed the cards, not at the initial stage. And it's entirely possible that I misunderstood the process and was supposed to do it in this more iterative way. Except I could not ask anybody. I was homeschooled, so this was all done after I had completed the video lesson. I couldn't just ask for clarification from the teacher.

Not technically “research notes”, but the method has also been useful for constructing other kinds of outlines like I did while working on my exams and course outlining.
Using the Cards
Once we had the cards, we could then start sorting and mixing. The method encouraged us to "storyboard" our writing. We were supposed to lay out the cards on the floor and move our cards around and organize them into our emerging response. I always loved that part. By the time that I started to do this process I usually had around 200 cards or so. It was so helpful to sit down, read each card, and place it on the floor. It was like building a road map or a blueprint for the design. I could actually visualize how my thinking was changing as I decided to move one card from one place to another.
As previously mentioned, I was always confused at this stage though. Because I had added outlines to the cards, and at the time I was using a pen more than a graphite pencil for this, the note felt permanent not like something I could change as my thinking changed. This meant that it started to feel like there was some disconnect in this process to the way that my own thinking was morphing. The metamorphosis of the paper was not reflected in the type of storage here. (This is one of the reasons I later started to appreciate working with computers.) At the time though, I decided that I could probably switch to using pencils instead of pens as a more temporary solution. That meant that I could erase some of the headings and add new headings as I felt like the meaning of the notecard changed based on seeing the note card in context with so many other cards and references of information.
Note Cards in Context
When I started to attend high school, I discovered that I was the odd one when it came to taking notes like this. Most of my classmates thought this was an incredibly antiquated form of learning. Why was I using physical notecards when I could just make a Word document? Wasn't this the purpose of a research notebook? Wasn't this a waste of paper? And couldn't you lose all the cards? Taking notes in a Microsoft Doc was much more efficient and permanent. It was also easier to store and hold the individual note. There was no need to separate out individual notes and cards like this when a single document per source could become a note taking entry book.
They were half right. The technique is old, but I'm not convinced it's antiquated.
These past few weeks, I have been going back to this method. I've printed out several pages. And I have gone back to those old headings. I've started combing them again into a larger outline. This has helped me to visualize the argument, and it has allowed me to think differently about the goals of each section.
It's especially interesting to think about these practices in the context of some of my own research on inscription and graphical representation. I hope to write more about a couple of recent books that have helped put this into a new perspective: Markus Krajewski's Paper Machines and Matthew Eddy's Media and the Mind.
These are worthy of a review.

An Early Post
Welcome to my personal site.
I’ve debated with myself for the past several months about what kind of format I wanted to use for a personal site and place to post research missives, some informal write throughs of my dissertation planning and design, and connections between my research and news. I thought about starting a Sub-Stack and posting there. It’s less hassle and easy to maintain. I have a few friends and people I admire who have been using it as an outlet.
But I decided to host my own site for several reasons.
Practical Reasons
On the one hand, I have practical reasons for wanting to publish on my own site. I have the skills to run a website. I started learning HTML and CSS in high school, and I have created several types of websites, including course sites, personal sites, blogs, and writing collaboratives. For almost two years, I volunteered to be a site manager too.
I know many people choose to use a site like Sub-Stack or Medium (which I have also done in the past) because it removes many of the technical challenges. Let’s face it, setting up a server, designing, and managing a site is difficult. It’s not usually the primary motivation for why people turn to writing. And it can be super time consuming. It feels like the time spent on management takes away from the main goal of sharing the writing.
But the truth is I do have some ability to make it work. And I can do it. So if for no better reason than to demonstrate and practice some of my coding skills, I chose to host the individual site on my own. This way I can control some of the design, and I get the chance to review HTML and CSS and build something that I am proud of and is my own product.
It feels good to go back to some of my roots. I don’t work in an overly technical field. But I do feel pride in myself when I figure out how to fix a small error or adjust the script to achieve a final result. Those kinds of small achievements are great motivators for me to continue to build and work on the site.
Fighting the Algorithm
It’s not just the chance to practice skills though. At a broader level, I share the wider concern about my data and the push toward increasing engagement. One of the reasons that I had considered to use Sub-Stack especially was because I thought it might be a good place to find a broader audience. I still there are parts of that which are true. But I’m no longer convinced. Rather I think if I want to read something I should have the control over how I access that information.
I agree with articles like this one which point out that in the early days it seemed like Sub-Stack was a great option for young writers, not only because it simplified the technology but because it put the focus on writing and reading. It was based on organizing readership, and it encouraged slow reading.
When I first discovered it, I was genuinely excited that it promoted long-form writing. Some writers said they also felt liberated by the format, as it offered them a chance to write more in their personal voice. Even though so many people claimed that long-form was a dead-end, and our attention spans had become so short that the feature essay was a thing of the past, many of the early writers on Sub-Stack (and actually it’s still true today) write in long-form.
However, in the past couple of years, that platform has especially borrowed from other social media models like X or Facebook. Some of the recent turn to notes feels like a repeat of the changes that occurred at other social media platforms. I have left (fled?) those platforms. I do not want to participate in the cycle of negativity, misinformation, and general feeling of hopelessness I find there. The only kinds of posts that are promoted are those that seem to feed angry, outrage, and tribalism.
I want to control what I write and put out instead. Maybe I am naive. After all, I am still having to pay to host the site. I do recognize, of course, the potential of relying on other institutions to support the other kind of work. But maybe it is the process of putting in all the work that cultivates the reward?
Besides that, I do not want to feel as though I am trying to optimize my writing simply to get more engagement. My goal is more about sharing my passion and love. I want to write about how my research connects to current events, share thoughts about new publications and research, and generally talk about the exciting finds I am seeing through my research, archival work, and museum experience.
Writing
I hope over the next few weeks and months to continue adding to these posts with some additional material. I have imagined a few different genres that I will try to experiment with: current events, interesting historical objects, reflections on methodology and theories in timekeeping, some in-situ research notes, and reviews of some recent works.
Let’s see where it leads.